Let's Use Today To Test Out My Model Showing Statistically Significant NFL Spread Beating Results
I've been in the stat lab this week cooking up an NFL betting model I thought would be fun to try out for a couple reasons. First, we have a nice sample size of seven weeks to work from and I think I found an angle ready to be exploited in the market. Second, just look at the tweet above:
I can't tell if Dangerfield is befuddled by the boys starting 0-16 last Sunday or incensed they pillaged his wardrobe. Either way, someone needs to offer an alternative. The Advisors might have forgotten more about football than I know, but their performance last Sunday suggests they might have also forgotten more about football than they even know.
Here's what I want to do. I think it'd be fun to develop and test out some betting models that demonstrate predictive validity for purposes of blogging and tracking its success or lack thereof. This being the first. And I want to bring you along for the ride. It's all about the ride! Just know that while I've dabbled in some machine learning, I am not a professional by any means. But you gotta start somewhere! So, I'm going to explain exactly what's in the witch's soup and will blog weekly updates every Sunday morning with results up to that point and plays for the week.
Let's get to work.
The idea is super simple. Teams with a higher difference in total team DVOA (Defense-adjusted Value Over Average) from their opponent have a better chance of beating the spread when that difference is around 20 ranks in weekly DVOA standing after Week 7. Whatever that spread happens to be set at. Doesn't matter. DVOA is pretty much the best statistical measure out there to say which team is the best. Feel free to give this FTN article a read to learn more. That's why I thought I'd develop a simple, digestible model people can relate to.
At first blush, you might think "well no duh the better team is likely to beat the worse team", but let me remind you we're talking spreads here, not moneylines. What appears to be happening is that oddsmakers might be suppressing how much better great teams are vs terrible teams when setting the lines. And apparently the public isn't correcting them. It's really that simple.
I compiled spread results and weekly NFL team DVOA (leading up to that week) for every game from Week 8 and of the regular season from the last ten years, except I removed the COVID 2020 season. Home field advantage was ruined with no crowds and that entire year was kind of the wild, wild west in setting lines. And the reason I start with Week 8 is to give the weekly DVOA numbers a chance to settle in a more reliable rank.
Quick example - if the #1 team in DVOA from Weeks 1-7 played the #5 team in Week 8, the DVOA difference would be 4, ergo positive numbers mean the team was that much better than their oponent. The lesser opponent in this example would be a -4.
At first I thought about using a random forest model which is what the mob uses when they need a nondescript location to drop a body. But that's not exactly what we're talking about here. It's a classification model so it treats differences in DVOA as categorical groups instead of numbers on a continuum. But if our theory here is that the greater discrepancy in team quality results in oddsmakers underselling that discrepancy, this approach doesn't jive. We need a regression approach to smooth this all out and treat DVOA differences numerically.
You, the stats layman: "How can we perform a regression if we haven't even gressed?"
Honestly, a good question. This actually makes me realize why stats words are sometimes so random and bizarre. Think about it. You're either a math person or an English person. English majors say they don't do math and vice versa for math majors. Well, if that's so, then who created all the math words? Obviously math people who don't know shit about English. But none of this is important for this blog, so I digress.
You: "Wait… did YOU even gress?"
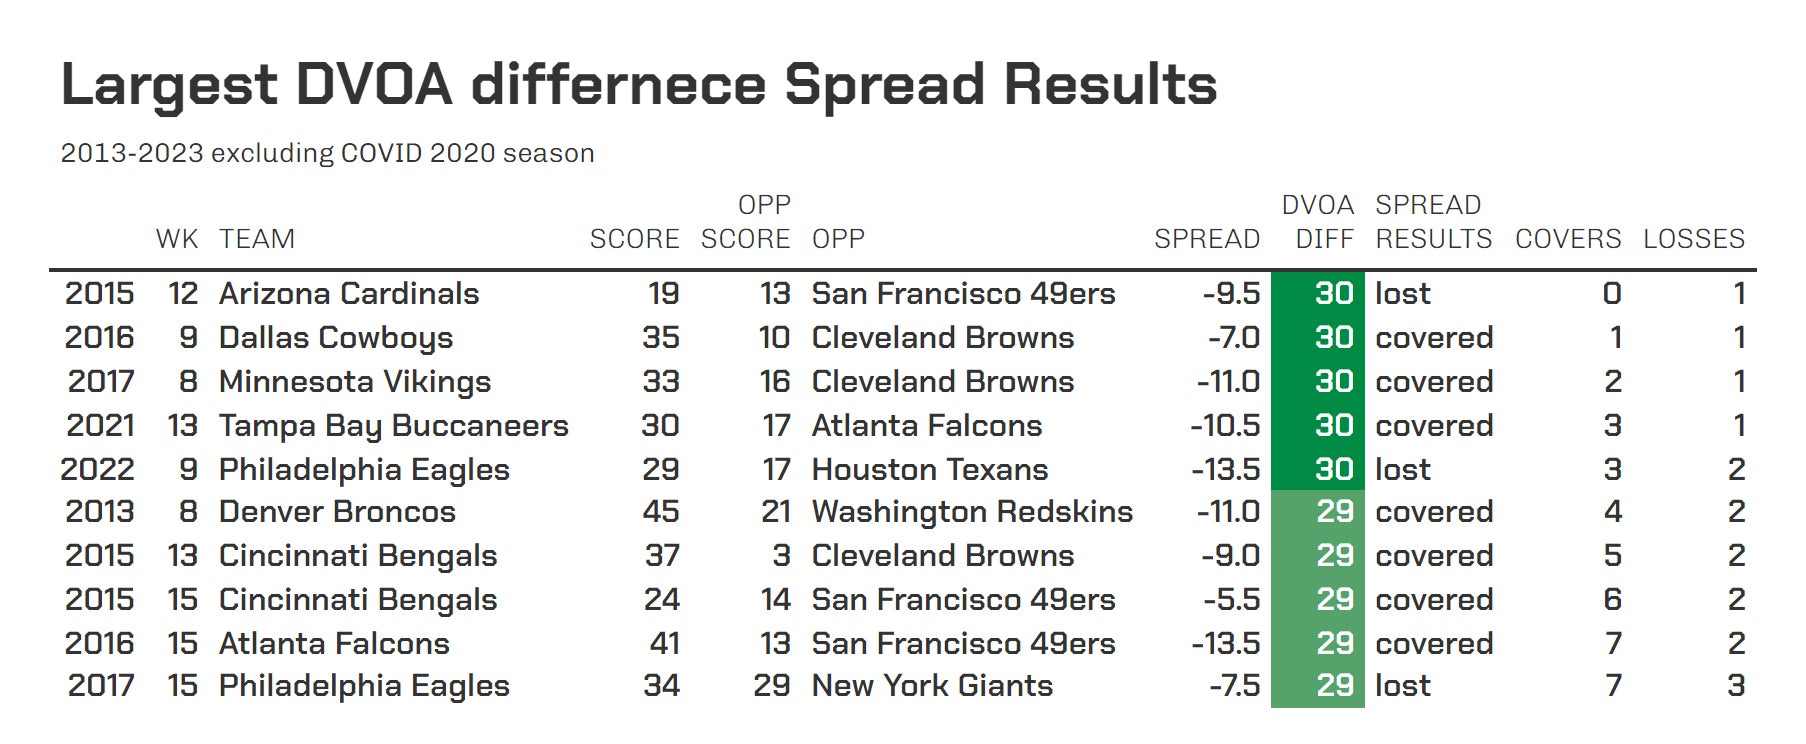
Moving on. Let's get things started with a little data exploration. Say we take this ten-year sample and sort every team in order of biggest difference in DVOA from their opponent and track whether they beat the spread or not. Then, we'll tally the running record as we go down each row. For instance, here is the first ten rows with the greatest DVOA differences in the sample. The teams with the better DVOA went 7-3 as shown by the last two columns.

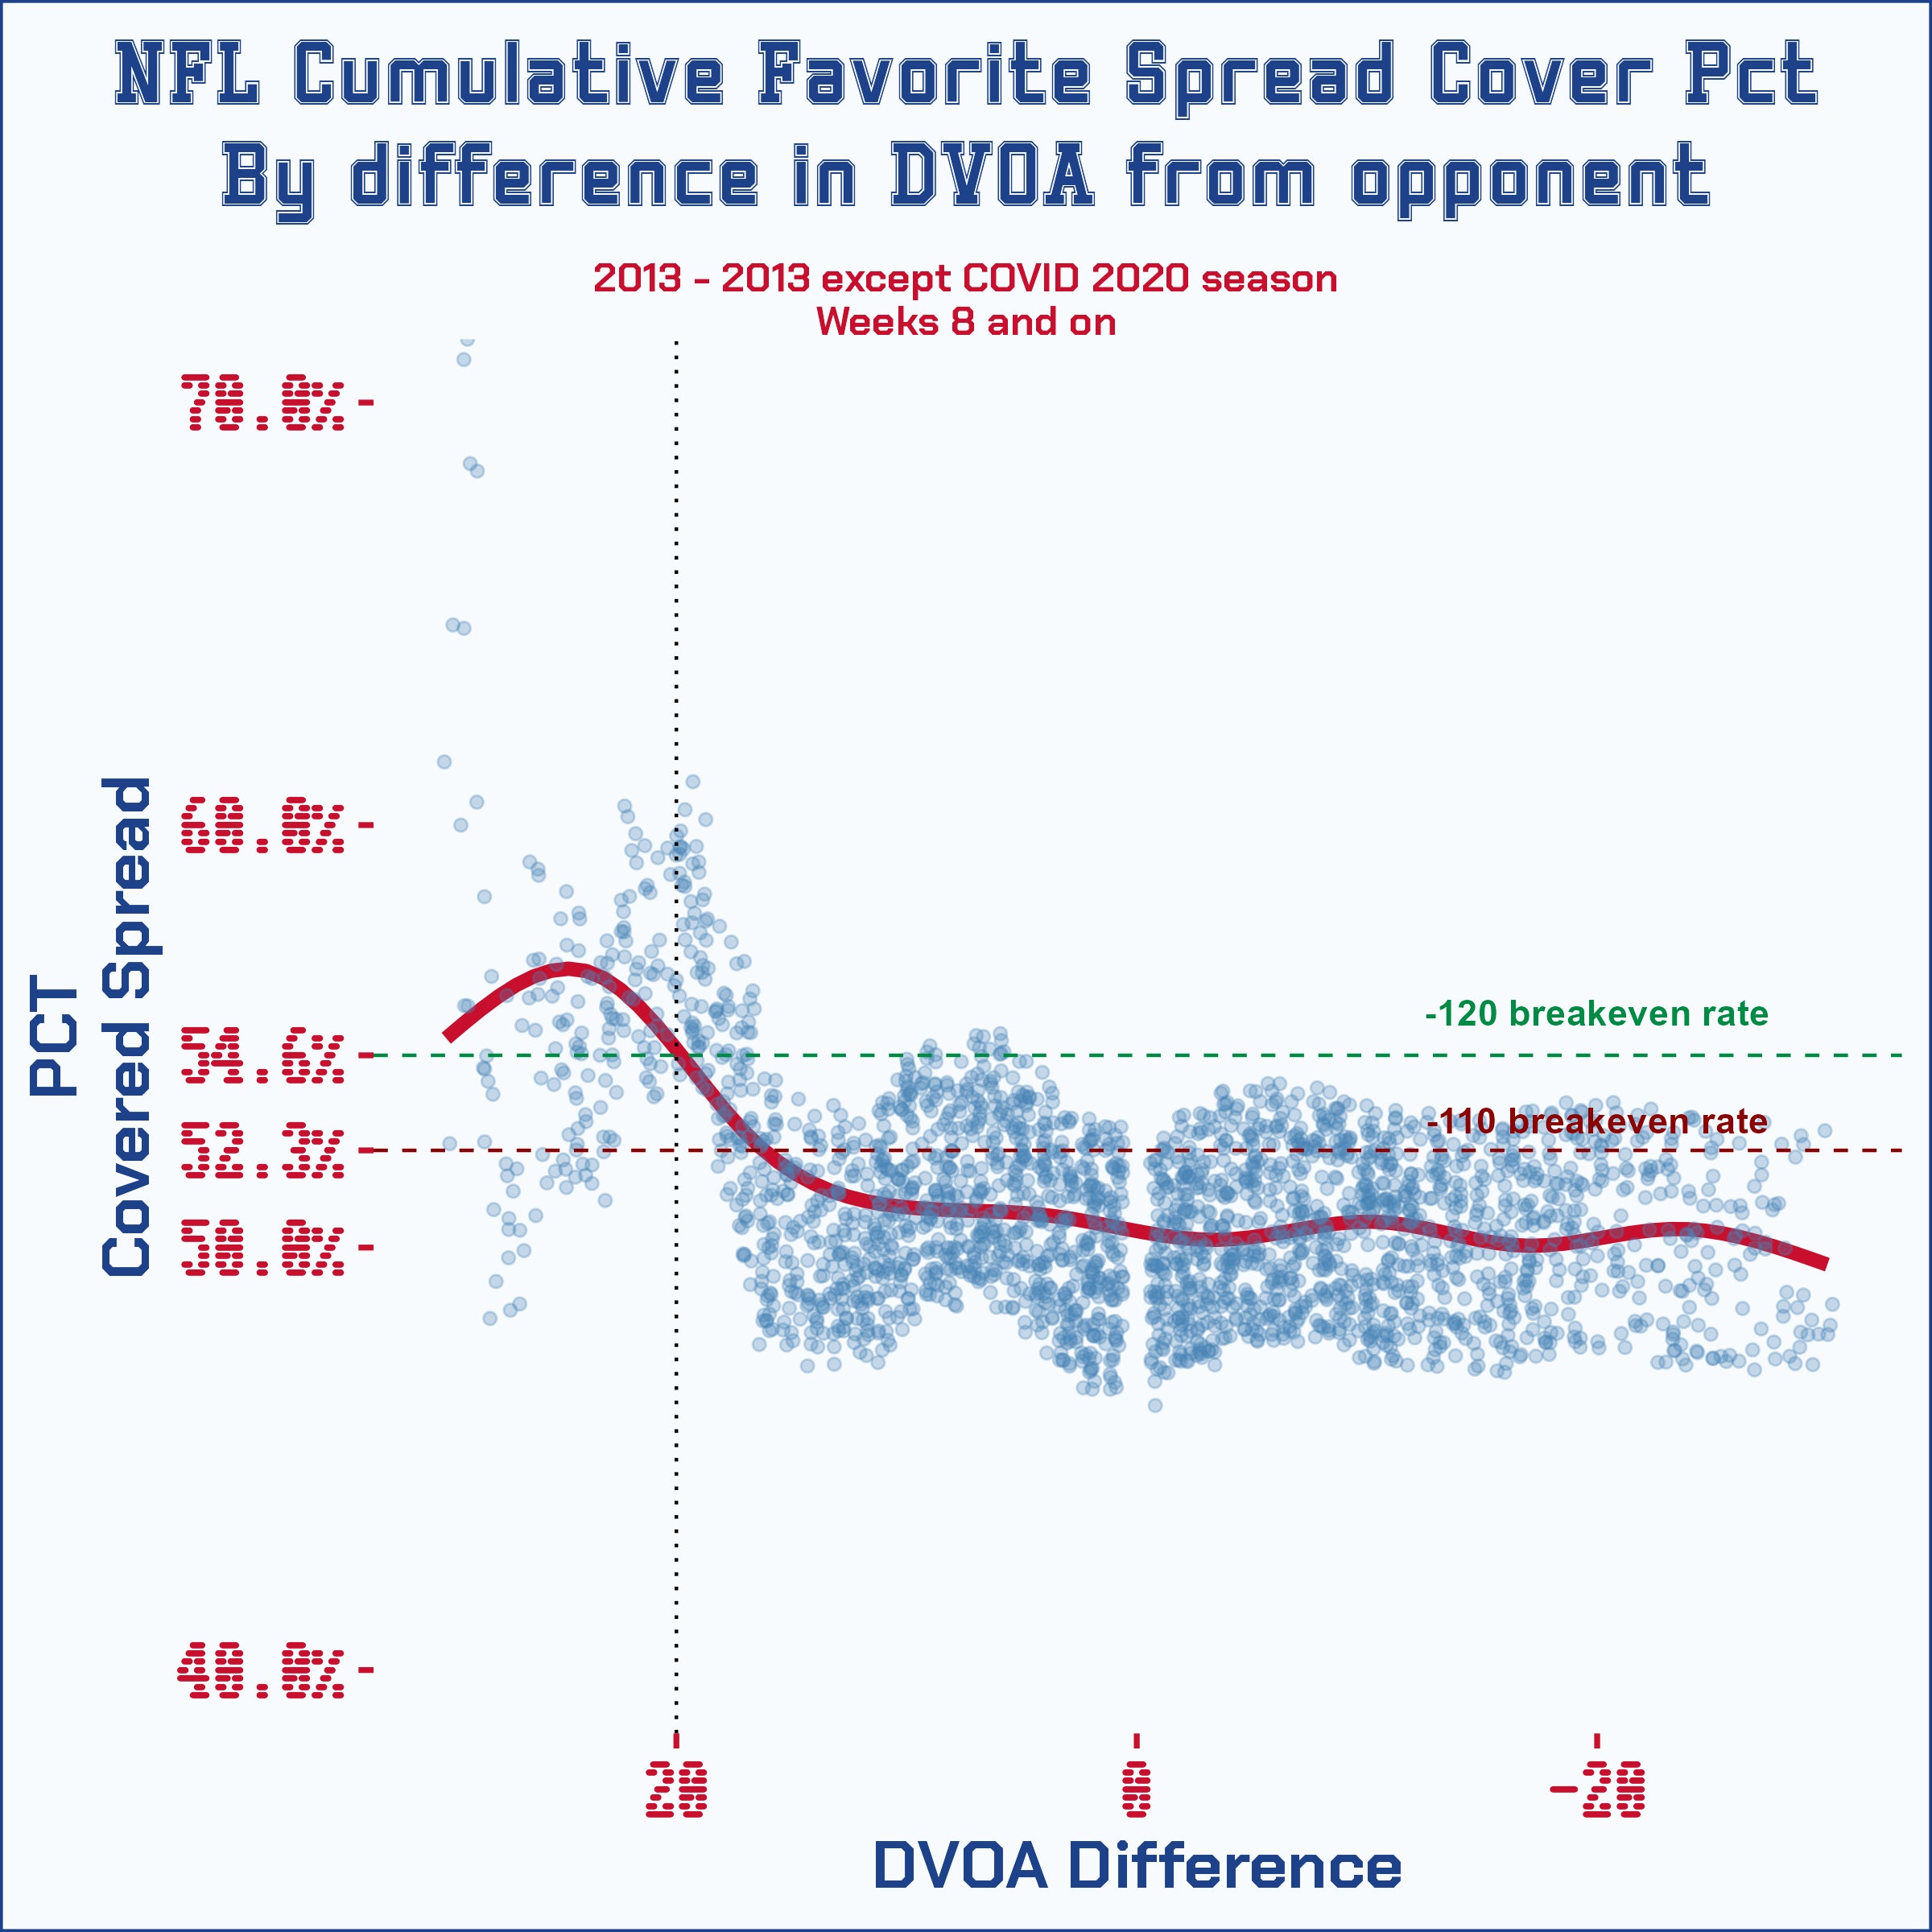
Alright, now let's do that with the entire ten-year sample. Except that we'll convert those cumulative records into winning percentages for each row and plot them as the blue dots as done below with a corresponding red trend line. Moving from left to right, that trend line gives the cumulative winning percentage of all DVOA differences from whatever number on the x-axis you're looking at to the greatest difference of the ten-year sample (30).

Obviously, the hump at the beginning is where we want to focus. I drew a green and red line where the breakeven point falls when considering house edges on spread bets at -110 and even -120. Even assuming a high house edge of -120, betting on teams with over a +20 difference in DVOA garnered a return on investment.
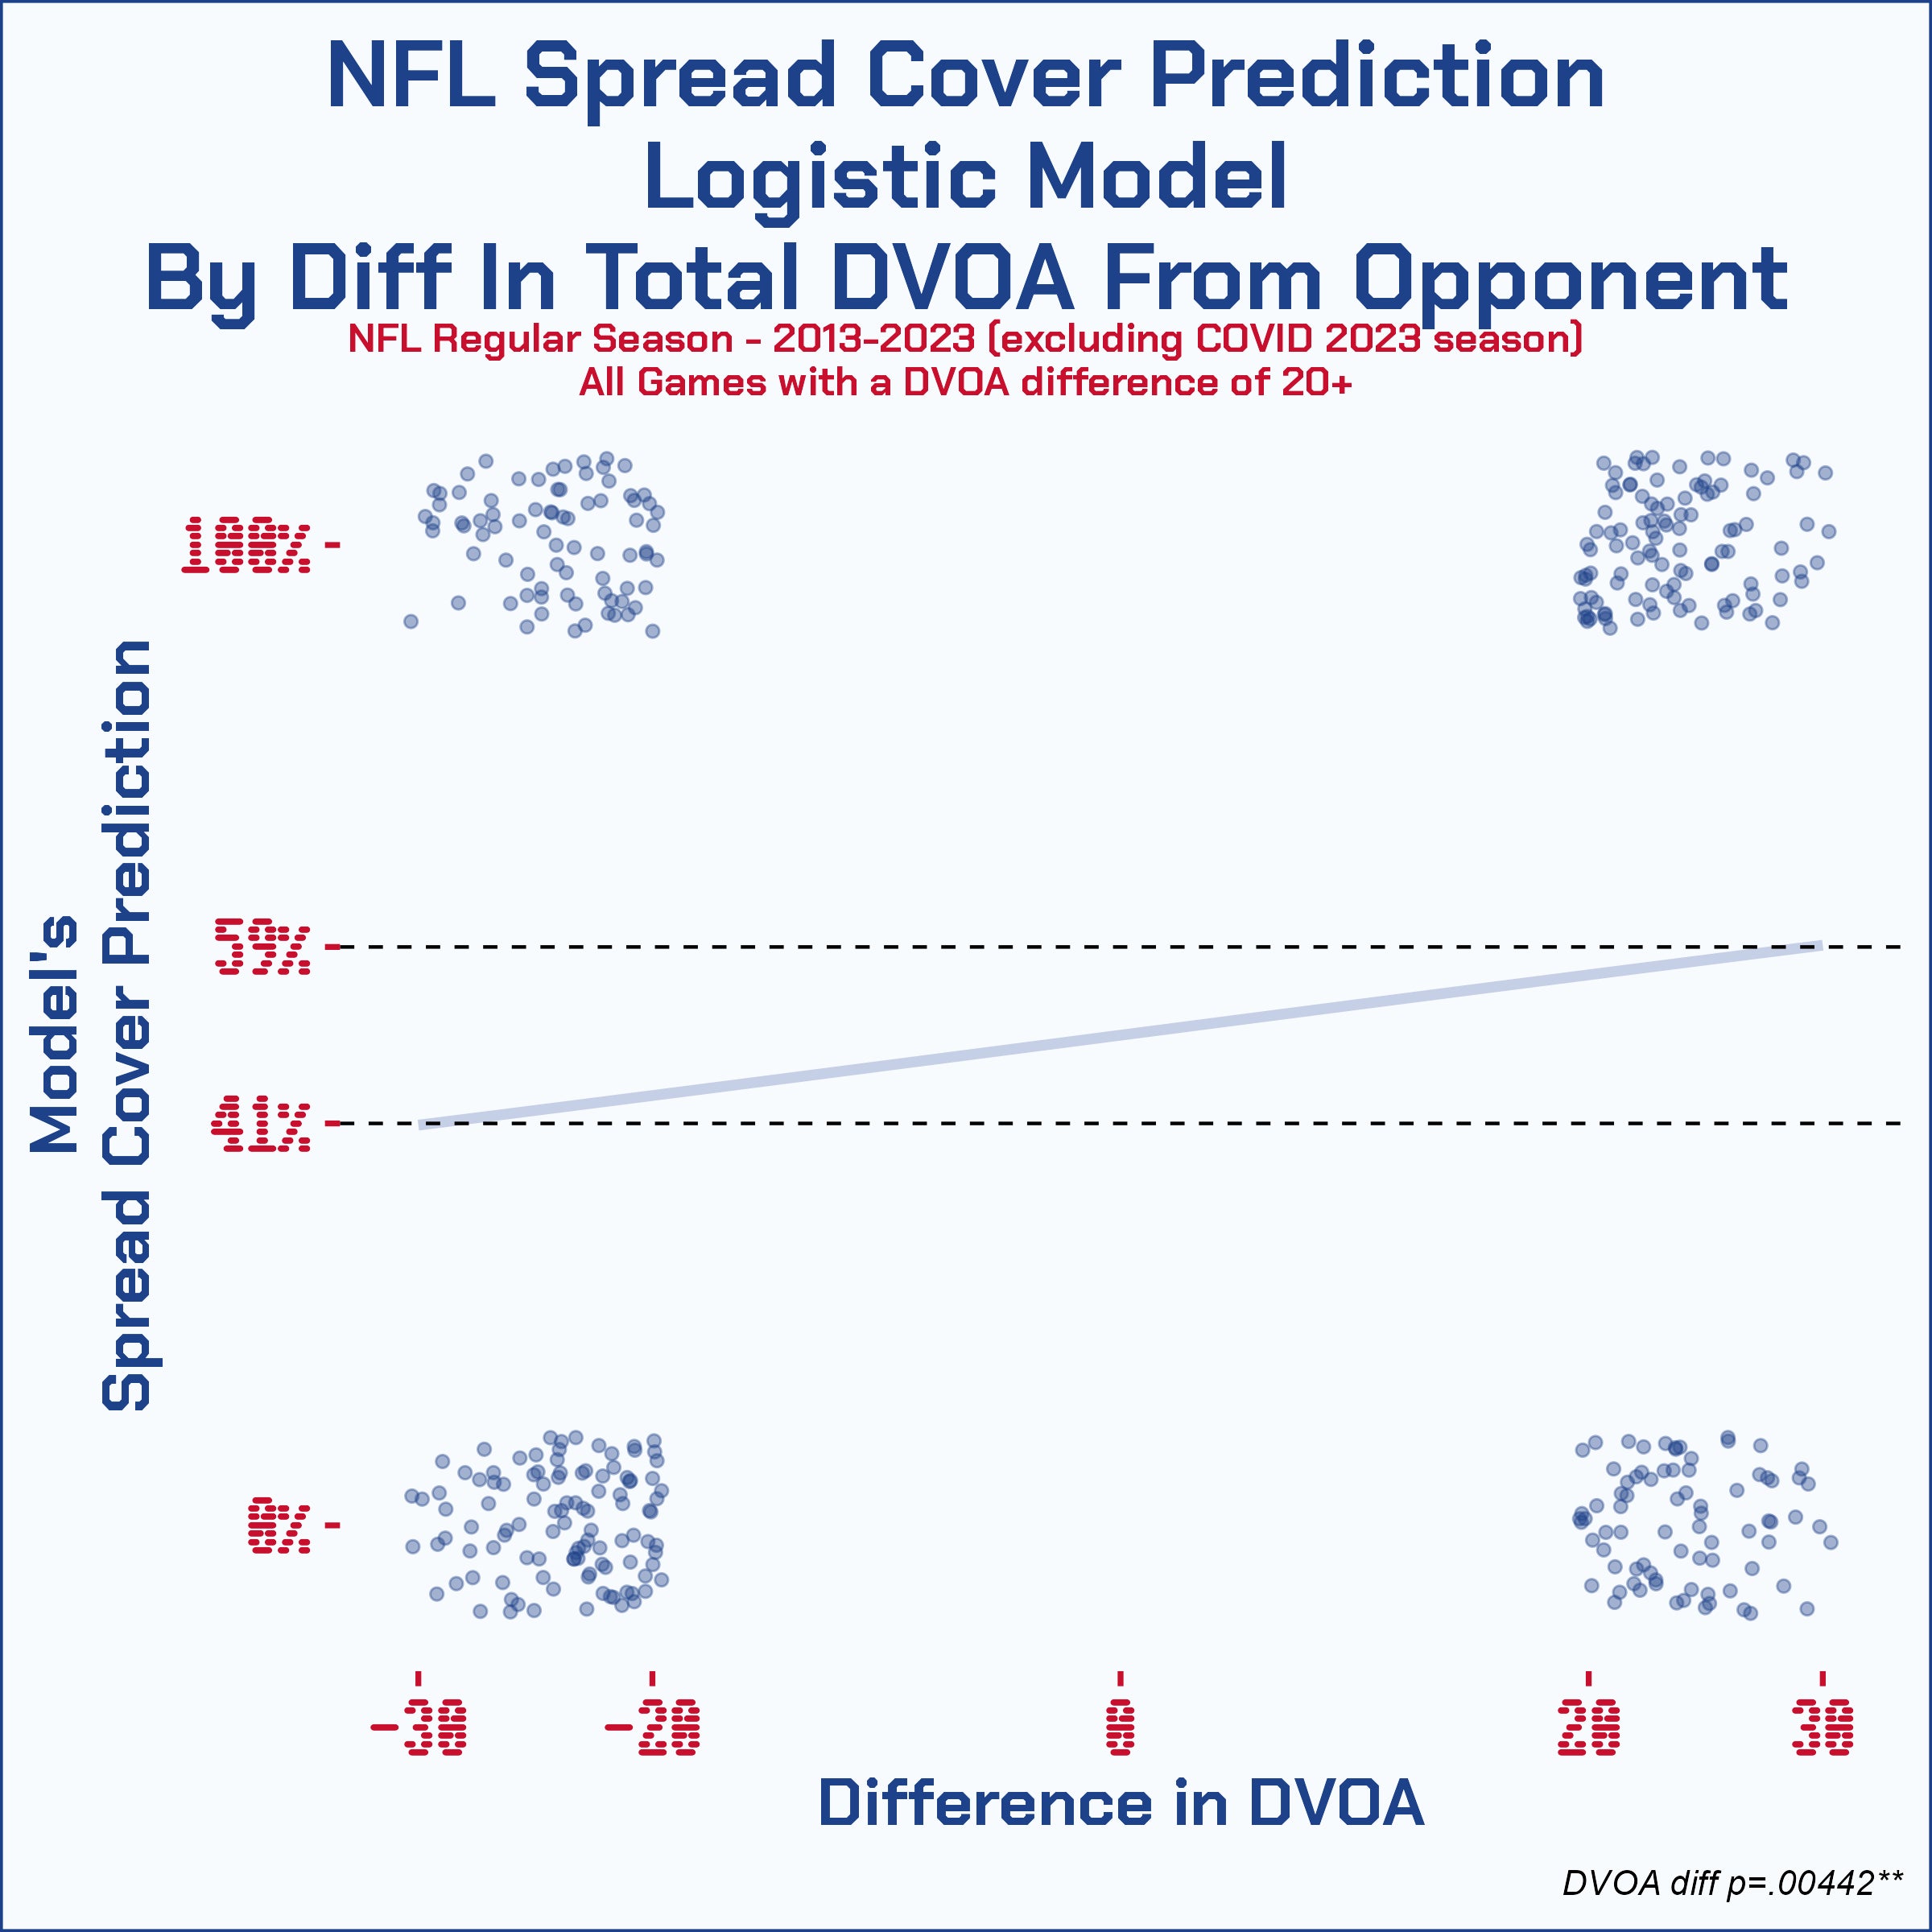
But is this statistically significant? That's where our logistic regression comes into play. There were 374 games with a 20+ difference in DVOA between two teams from this ten-year sample. Those are all plotted below with the logistic regression line that is every bit as statistically significant as it appears (p=.004):

Quick recap. We looked at the last ten years of data that doesn't include the whacky 2020 season and attached each weekly DVOA rank update for all teams going into that week and found teams 20 ranks of DVOA better than their opponent were so much more likely to beat the spread that betters would have profited even when laying $120 to win $100. Logistic regression confirmed the statistical significance of this with our sample of 374 teams with either a 20+ difference or deficit from their opponent.
There's only one thing left to do now. Make some plays. Finding games with such a disparity in DVOA isn't going to happen every week, but we're in luck today. I see a ripe slate of lopsided matchups ready to put this model to the test.
My Plays
Ravens (-8) at Browns -110
DVOA difference = 30
You might say Jameis starting changes things, but then again the Browns also lost Cooper. So there's no reason to override this. And with a 30-rank difference, this is the best team going against the second worst team. There is simply no way the Ravens can screw this up and lose to such an underdog (again).
Chiefs (-9.5) at Raiders -110
DVOA difference = 24
Yeah - I'm all in on this one. This is really the only model you needed for this game though…
Packers (-4) at Jaguars -112
DVOA difference = 18
Given the -112, I'm OK dipping a little bit under that 20 DVOA ranks threshold based on our first graph. This line just seems low too anyway. The Jaguars beat the Patriots and they all the sudden get some semblance of respect? Not from me.
Broncos (-11) vs Panthers -112
DVOA difference = 22
Not gonna lie. I would never in my right mind bet on Bo Nix -11, so this is a blind trust of the model here. Broncos as the 10th best team in DVOA is pretty shocking to be honest.
Lions (-11.5) vs Titans -110
DVOA difference = 25
This one I can wrap my brain around at least.
So here we go. Remember, this is test out week. This might all be BS. But let's have some fun.
Hopefully I don't go 0-5 or I might be headed for Rodney Dangerfield's closet.
#DKPartner


